Spectrophotometers are prominent devices in many industries and offer value for many purposes. The concentration of a chemical can be determined using spectrophotometry data. Constructing a calibration curve is one of the ways users employ spectrophotometers. This technique, much like the device, works across many applications. At HunterLab, we specialize in spectrophotometers and support operations that create calibration curves. Calibration curves have applications in several domains, including analytical chemistry and pharmacology.
What Is a Calibration Curve?
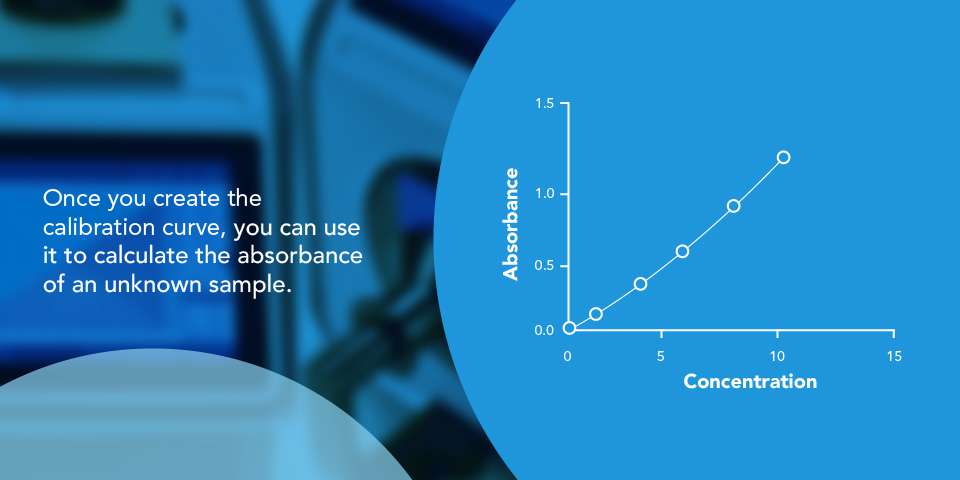
A calibration curve, also known as a standard curve, is a way to identify the concentration of an unknown substance. It calculates the concentration of the unknown material and quantitation by comparing the sample to a set of known concentration reference samples. The data fits into a model that predicts unknown concentrations. The concentration of the material causes a change in the analytical signal or instrumental response, as demonstrated by a calibration curve.
Calibration curves are beneficial for compounds that directly absorb light. Typically, a dye consists of molecules that absorb or reemit light, and spectrophotometers can measure that reaction. Begin with a known chemical, measure its absorbance or color attribute, and then graph it. Second, calculate the absorbance of the unknown sample, plot it on a graph, and apply a calibration curve to get the estimated concentration.
These curves use data points of substances at varied concentrations, and researchers can use these curves to find where an unknown substance plots. An ultraviolet-visible (UV-Vis) spectrophotometer measures the absorbance of a chemical that absorbs light in the ultraviolet or visible parts of the electromagnetic spectrum. This system of identifying unknown substances is valuable to many industries. For example, a calibration curve for the food industry may chart food dye concentrations for gelatin.
Other applications can include:
Simply put, a calibration curve in spectrophotometry is helpful in any situation where a substance is unknown.
How to Make a Calibration Curve
To make a calibration curve, you need the following:
- A standard solution
- A solvent for dilution
- Pipette and tips
- Five microtubes
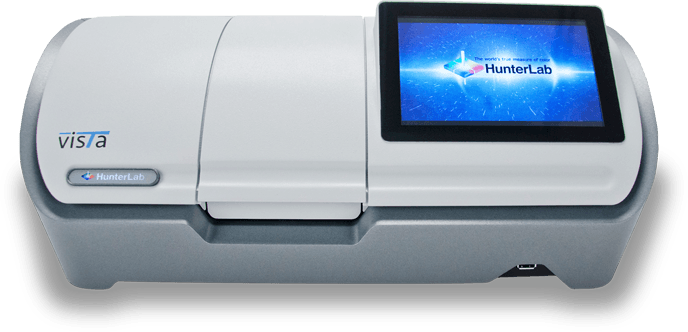
- UV-Vis spectrophotometer
Key steps include:
- Standard preparation: Create a concentrated standard solution and dilute it to generate five multiple known concentrations.
- Sample measurement: Using a spectrophotometer, measure each standard solution and your unknown samples at a wavelength of interest or as specified by a colorimetric index, such as the Yellowness Index.
- Data analysis: Plot the measured result (y-axis) vs. concentration (x-axis)to establish a linear calibration curve. Use statistical software to fit the data to a linear regression equation (y = mx + b) and determine the coefficient of determination (R²) to assess the goodness of fit.
How a Calibration Curve Is Used
Calibration curves are used in many scientific areas to calculate the quantity of unknown chemicals in a sample. Here are some popular applications:
- Environmental monitoring: Calibration curves are essential for measuring environmental health. They may be used to determine the concentrations of contaminants in soil samples, such as heavy metals or pesticides.
- Pharmaceutical quality control: It is critical to ensure pharmaceuticals are effective and safe. Calibration curves are used to accurately measure the quantity of active drugs and other components in pharmaceutical samples.
- Food and beverage analysis: Calibration curves play an important role in guaranteeing the quality of food and drinks, from monitoring caffeine concentration in beverages to ensuring vitamin potency in fortified products.
What Is an Ultraviolet-Visible (UV-Vis) Spectrophotometer?